Hello, I'm
Turning raw data into clear stories and smart decisions.
SQL, Python, and Power BI — from messy datasets to executive dashboards.
I'm Ayman Elmarsfawy, an MIS graduate specializing in data analytics. Over the past year, I've built end-to-end analytics projects — from SQL data extraction to Power BI dashboards — including a graduation project analyzing customer retention for a Brazilian e-commerce marketplace with 99K orders.
My workflow spans the full data pipeline: cleaning messy datasets in Python, writing SQL queries to extract insights, modeling data with Star Schema in Power BI, and communicating findings through executive dashboards and DAX measures.
I'm certified in Microsoft Power BI (PL-300) and Azure Data Fundamentals (DP-900), and I'm actively looking for a Junior Data Analyst role — on-site in Cairo or remote for Gulf-based companies.
Let's Work TogetherThebes Academy · Cairo, Egypt
Pivot tables, advanced formulas, data modeling, and dashboards for business reporting.
Writing complex queries, joins, and aggregations to extract insights from large databases.
Data cleaning and analysis using Pandas, Matplotlib, and Seaborn to process, explore, and visualize datasets.
Interactive dashboards and business intelligence reports using DAX and Power Query.
Transforming and cleaning raw data with automated ETL pipelines inside Excel and Power BI.
Collaborative spreadsheets, formulas, and data analysis in the cloud.
Tracking project changes, managing versions, and collaborating on code using Git and GitHub.
Familiar with core visualization concepts and chart building. Actively expanding skills.
Familiar with building basic reports and connecting data sources. Actively expanding skills.
Interactive dashboards that let teams track KPIs, monitor trends, and make faster decisions — all in one place.
Turning messy, raw data into clean, structured datasets ready for analysis — uncovering patterns that matter.
Replacing slow, manual monthly reports with automated pipelines — saving hours of repetitive work every week.
Presenting data as a clear, visual narrative that non-technical stakeholders can understand and act on immediately.
Official Microsoft Certifications
Professional Training
Tech Mind · 2026
Modules: Advanced Excel · SQL · Python · Power BI | 120 hours
5 in-depth end-to-end projects
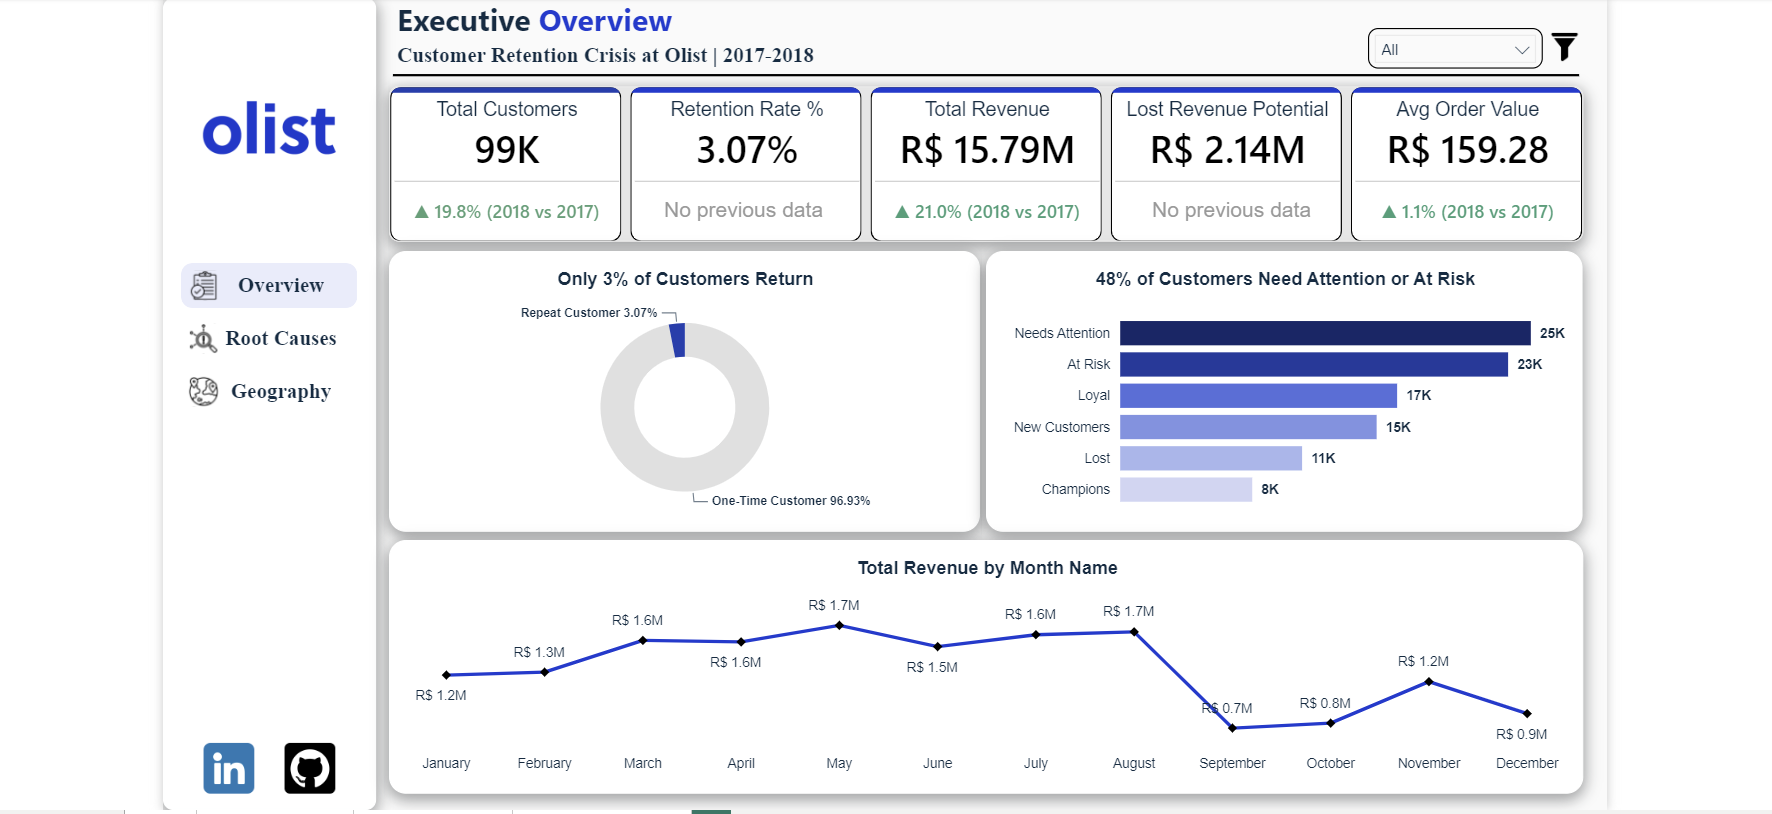
End-to-end graduation project — Python pipeline (EDA, cleaning, validation) across 9 datasets (~99K orders, R$15.8M revenue), connected to a 4-page Power BI dashboard with 22+ DAX measures uncovering a critical 3.07% customer retention crisis.
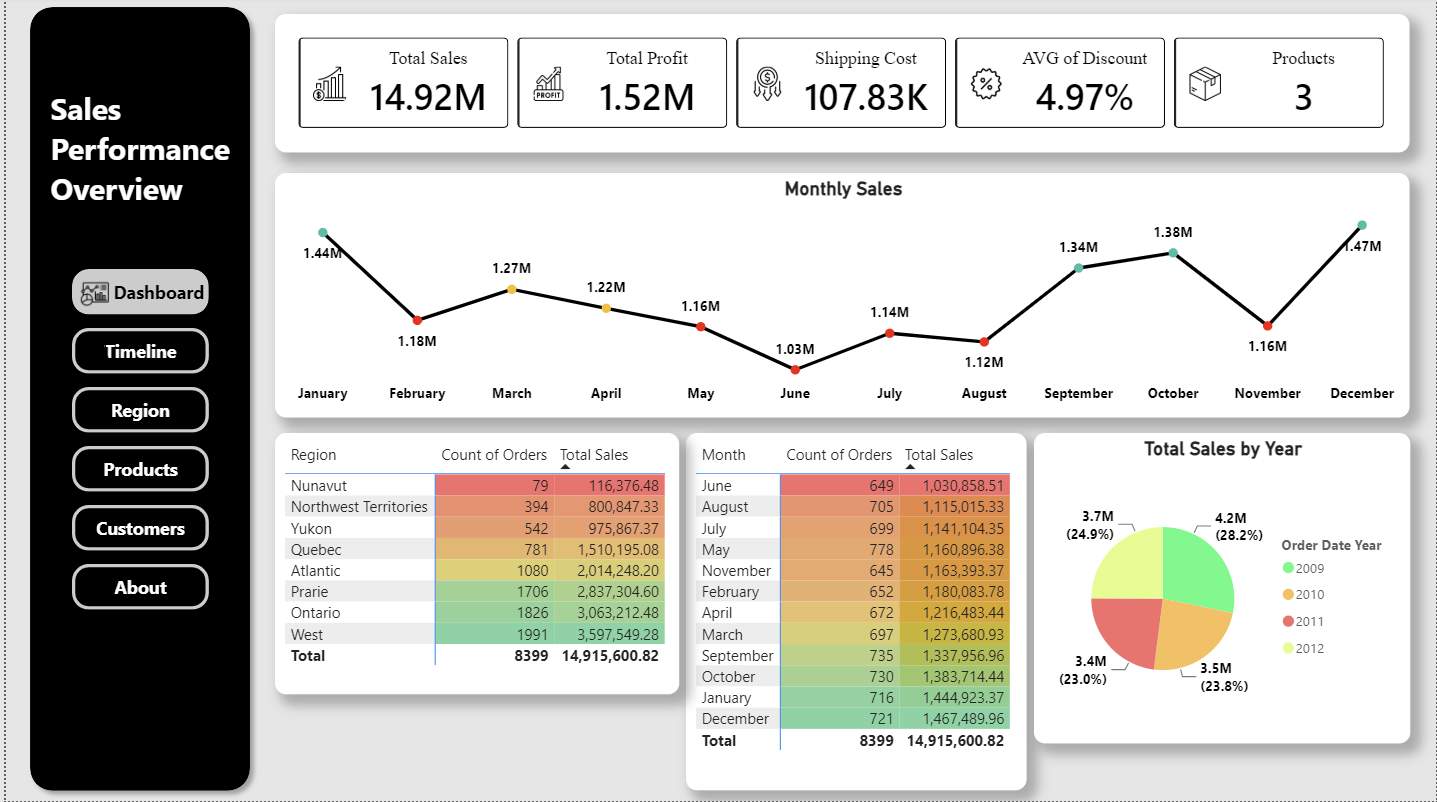
Interactive 6-page Power BI suite analyzing 4 years of global sales data across regions, product categories, and customer segments with custom sidebar navigation.
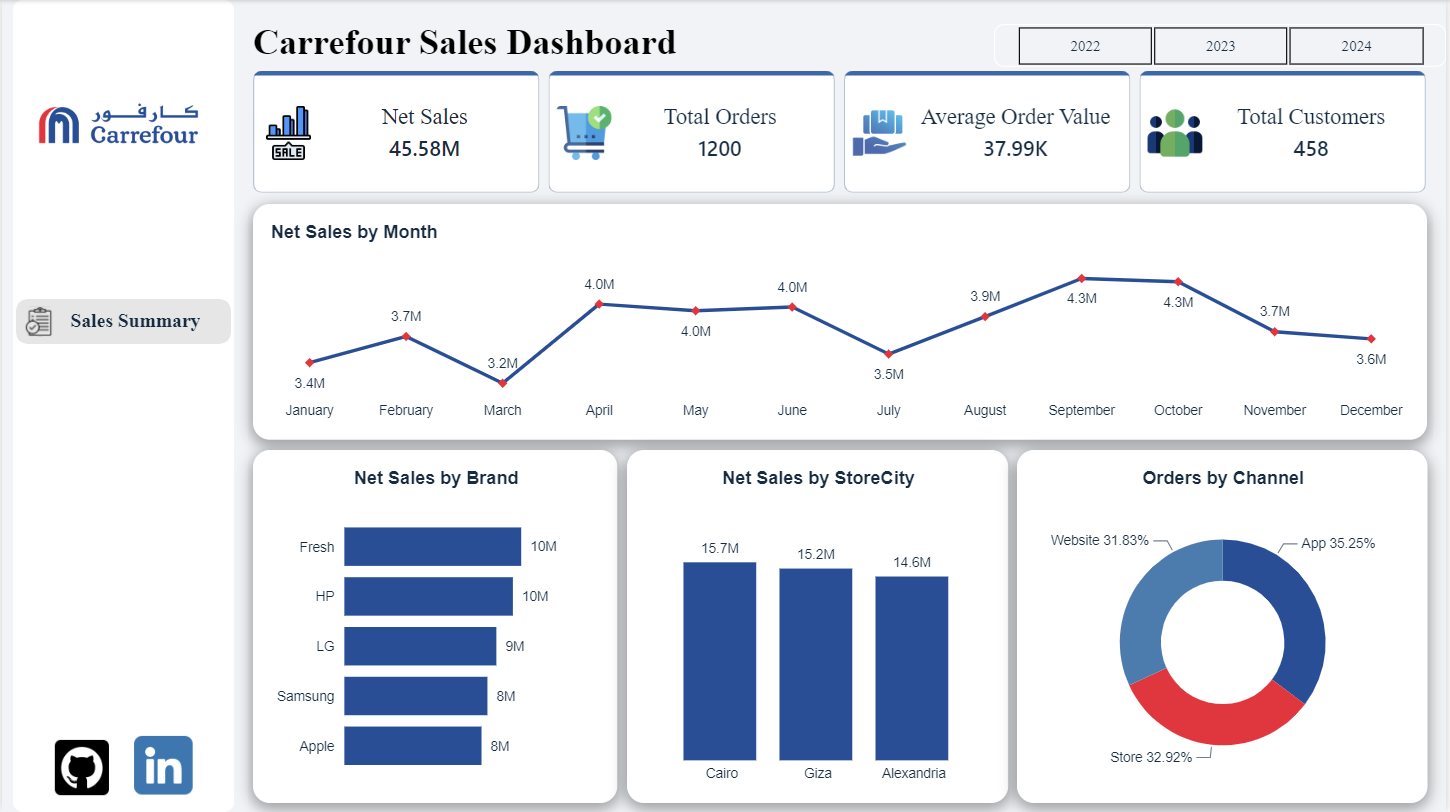
Executive-style Power BI dashboard analyzing Carrefour retail sales across cities, brands, and order channels with custom DAX measures and interactive drill-downs.
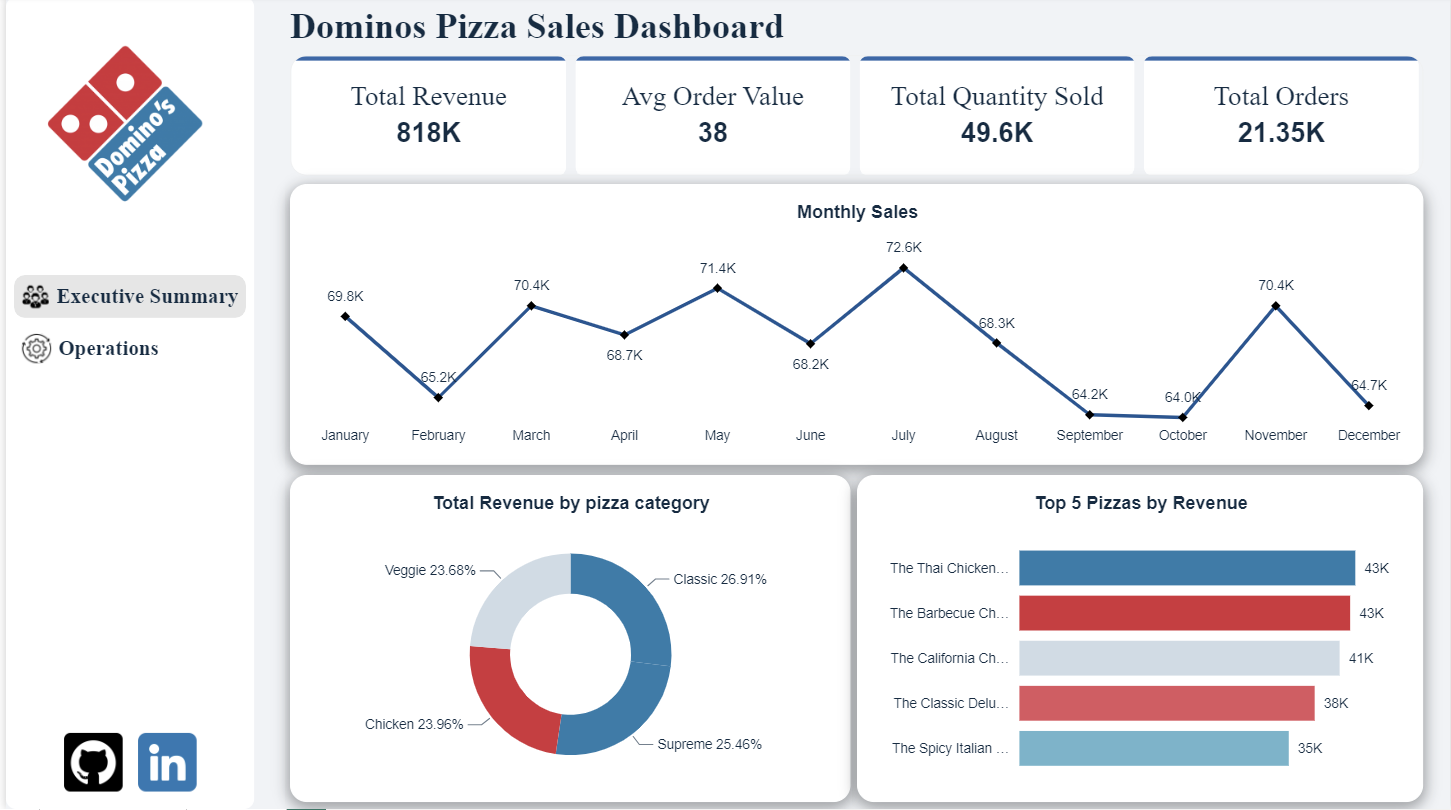
End-to-end analytics pipeline — 22 SQL Server views answering 20+ business questions on revenue and operations, connected to a 3-page Power BI dashboard with a custom Domino's theme.
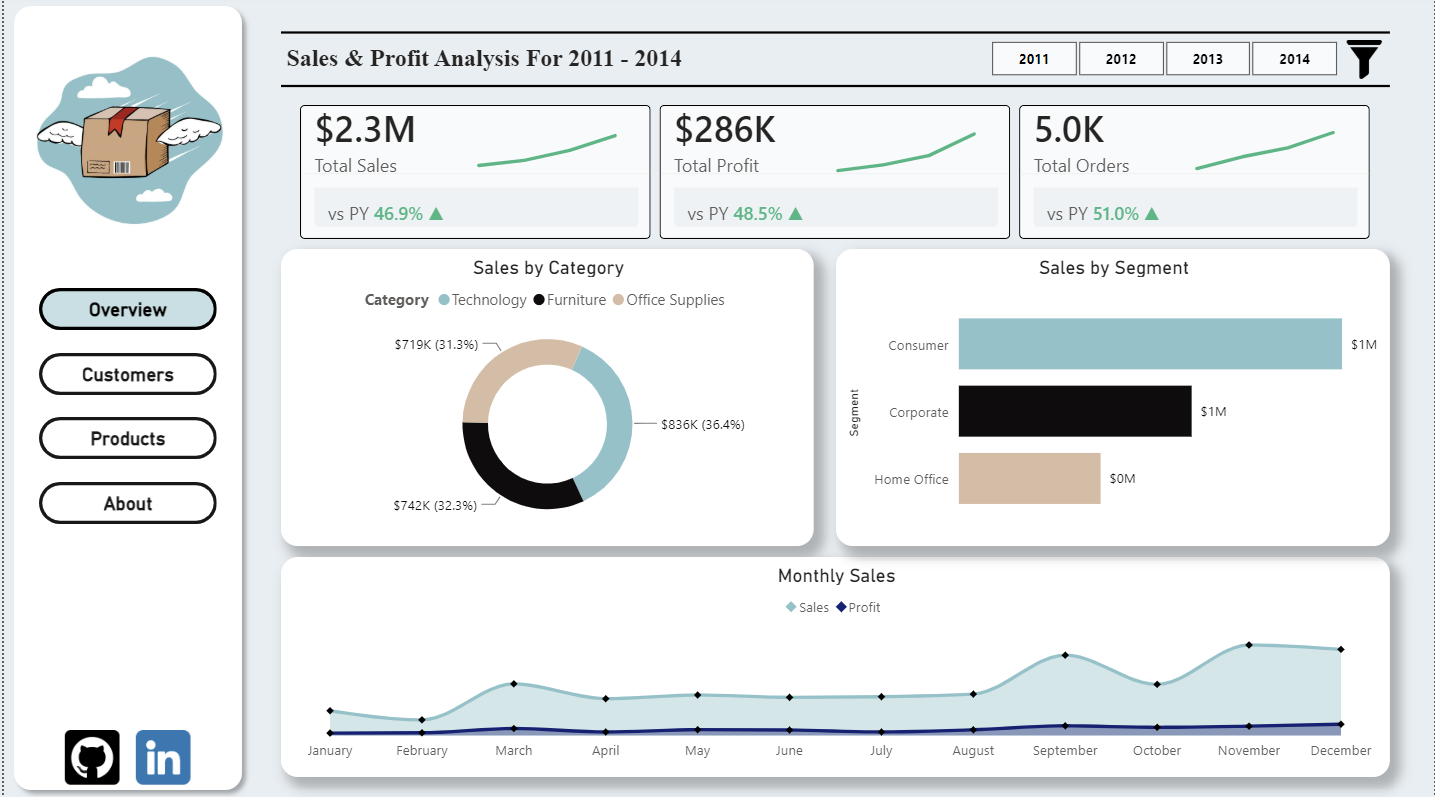
4-page executive Power BI dashboard built on a Star Schema (Orders, Products, CRM, Locations) with Time Intelligence DAX measures for YoY Growth and Prior Year comparisons across 2011–2014.
Have a project in mind, a dataset that needs making sense of, or just want to chat about data? I'd love to hear from you.